Introduction
Background context
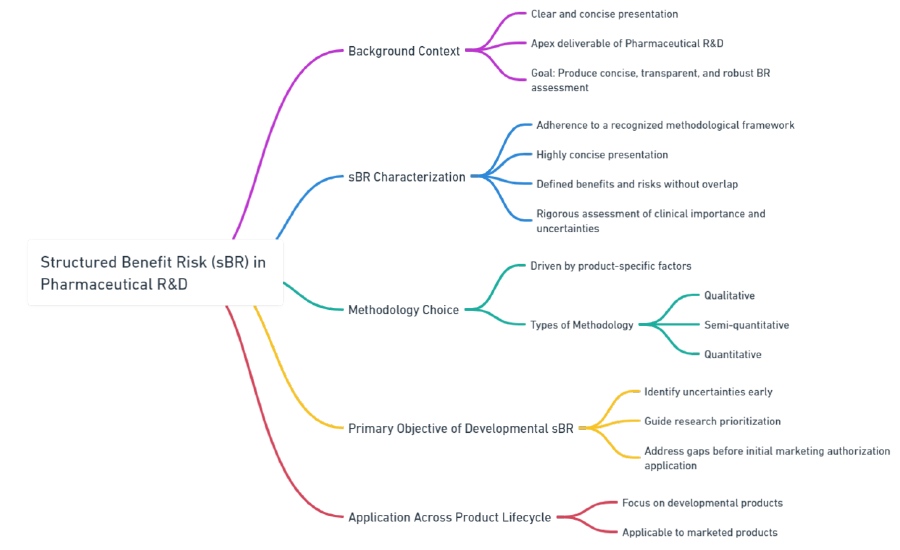
Benefit-Risk (BR) assessment is like creating a report card for a new drug that’s being developed. It’s about weighing the good against the bad in a clear way. This “report card” is really important in the world of Pharmaceutical Research & Development (R&D) because it helps decide if a drug should be approved.
Imagine you’re comparing two snacks to decide which is healthier. You’ll list their benefits (like “high in protein”) and risks (like “high in sugar”). For drugs, it’s similar, but you need to be very clear and precise because people’s health is at stake.
Here’s what makes a good BR assessment:
- Structured Approach: Using a well-known method to make sure nothing is missed.
- Clarity: The findings should be easily understood, even if someone reads them quickly.
- Specificity: Only include key benefits and risks, without repeating similar points.
- Thoroughness: Check how important the results are and if there’s any doubt in the data.
- Regular Checks: Have experts review and approve the assessment at certain stages.
Types of BR Methodologies
Depending on the drug, different methods might be used to make this assessment:
- Qualitative: This is more about words and descriptions, with a little bit of numbers.
- Semi-quantitative: This uses some standard math and ranks things in order. Quantitative: This tries to put a number on each good and bad effect, kind of like giving points to score them.
The Primary Goal
The main point of doing this early in the drug’s development is to spot any unknowns. It’s like identifying the weakest subjects in school early on so you can focus on improving them before final exams.
Example:
Let’s say you have a new medicine for headaches. Here’s a simple BR assessment
| Benefit | Risk |
|---|---|
| Reduces headache quickly | Might cause mild nausea |
| Easy to take (one pill a day) | Not suitable for children |
You’d then make sure this information is transparent and checked at different stages before the medicine is approved for people to use
Key Clinical Benefits and Key Safety Risks
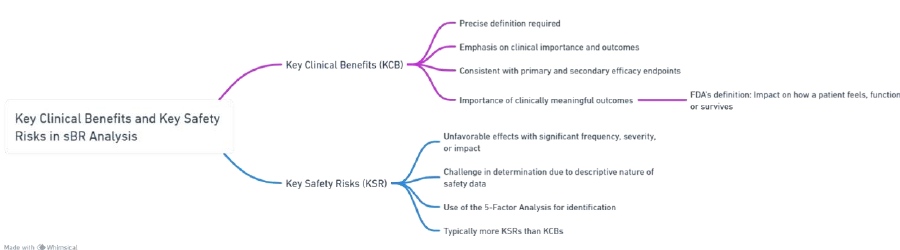
Each benefit and each risk requires a precise definition. It is recommended to make these as explicit as possible to facilitate interpretation of the data and to enable non-specialists to understand what is being measured, with an emphasis on clinical importance and outcomes.
Key Clinical Benefits (KCB)
For a Benefit-Risk (BR) assessment, you need to pinpoint a few key benefits of a drug, which are usually linked to the main goals of the big clinical trials. These benefits are called Key Clinical Benefits (KCBs), and they’re like the highlights of what the drug can do for patients.
Think of it like this: if a new fitness watch tracks both your steps (primary goal) and your sleep (secondary goal), the step count might be the most important feature for most people. But for someone who has trouble sleeping, the sleep tracking might be more valuable. Similarly, in medicine, while the main goal of the drug (the primary endpoint) is usually the star of the show, sometimes the secondary goals can steal the spotlight, especially if they lead to outcomes patients can feel, like easing pain or improving day-to-day life.
The U.S. Food and Drug Administration (FDA) says that it’s crucial to show that a drug truly makes a difference in how a patient feels, functions, or lives longer. This means we should focus on real-world benefits that matter to patients, not just numbers on a lab report.
Example:
Let’s say there’s a new allergy medicine. The main goal (primary endpoint) might be to reduce sneezing by a certain percentage. But a secondary goal could be to help patients sleep better because they’re not sneezing as much at night. Even though better sleep was a secondary goal, it might be the most important benefit for patients who are tired of allergy symptoms ruining their sleep. That’s what the BR assessment will try to show – how the medicine brings real, meaningful improvements to patients’ lives.
Key Safety Risks (KSR)
Key Safety Risks (KSR) refer to significant adverse effects that occur frequently or have severe consequences for individual patients and public health. In most clinical studies, safety data is described descriptively, making it challenging to identify KSRs.
Although KSRs often align with the “Important Risks” outlined in the Safety Specification and Management Plan or Risk Management Plan, a 100% correlation is not necessary. For instance, a KSR may exist that is not considered an Important Risk, and vice versa. For example, a skin rash may be classified as a KSR due to its impact on tolerability and subsequent discontinuation of product use, even if it is not considered an important risk.
| Category | Description | Examples |
|---|---|---|
| Key Clinical Benefits (KCB) | Precisely defined favorable effects, aligned with clinical study endpoints. |
|
| Emphasis on Clinical Importance | Focus on outcomes that significantly impact how a patient feels, functions, or survives |
|
| Key Safety Risks (KSR) | Unfavorable effects significant in frequency, severity, or impact. |
|
| Challenge in Determination | Safety data often descriptive,requiring careful judgment and tools for identification |
|
| Overlap with Other Plans | KSRs may overlap with risks identified in other regulatory plans but are not always correlated. |
|
Recommended Methodologies for structured Benefit-Risk assessment
The complexity of the selected methodology increases as the development phase progresses. This is because semi-quantitative approaches become more valuable and essential as more data is gathered.
This document does not aim to cover all available methodologies for sBR (safety benefit-risk assessment). but rather offers examples of recommended sBR approaches based on current and well-established practices.
For instance, in the early stages of development, a simple qualitative analysis may be sufficient to assess the benefit and risk profile of a product. However, as more data is collected in later phases, a semi-quantitative approach, such as a weighted scoring system or a risk matrix, may be more appropriate and informative.
Qualitative sBR methodologies
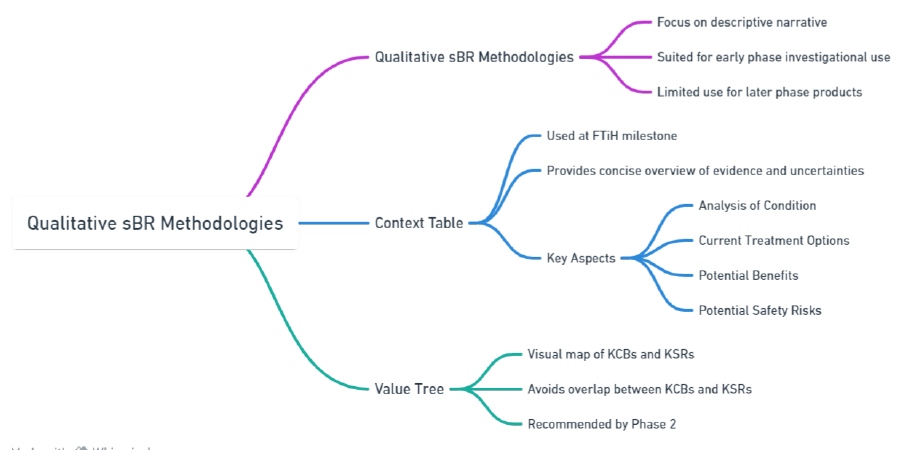
Qualitative sBR methodologies rely on descriptive narratives rather than calculated endpoints or numerical values. They are most suitable for early phase investigations (from First Time in Humans to Phase 2) or situations where data is limited, and the benefit-risk (BR) discussion revolves around context and overall program direction.
While qualitative methodologies are easier to develop compared to semi quantitative or fully quantitative sBR frameworks, they may not provide enough robustness for most later-phase products or those intended for submission. This is because a certain level of quantitative detail is necessary to transparently and efficiently demonstrate the benefit-risk profile to Health Authorities.
Context Table
The Context Table is a significant tool within the FDA’s structured Benefit-Risk (sBR) framework, playing a crucial role in drug regulatory decision-making, particularly during the First Time in Human (FTiH) milestone. Here’s a detailed discussion about its purpose and how it’s utilized:
Purpose of the Context Table
Overview of Evidence and Uncertainties: The table is designed to provide a succinct summary of available evidence and uncertainties regarding a new drug at the FTiH stage. At this point, data is often limited, and the table helps in consolidating what is known and unknown about the drug.
Qualitative and Descriptive Analysis: Unlike quantitative methods that rely on statistical data, the Context Table is qualitative. It provides a narrative or descriptive analysis of the drug’s benefits and risks based on the available evidence.
Support Decision-Making: It aids in the decision-making process by presenting clear and concise information, helping regulators and company officials understand the potential impact of the drug.
Components of a Context Table
While the exact format can vary, a typical Context Table might include:
Drug Information: Basic details about the drug, including its name, intended use, and mechanism of action.
Benefit Summary: A brief description of the drug’s potential benefits, such as its effectiveness in treating a condition or its advantages over existing treatments.
Risk Summary: Information on known or potential risks and side effects associated with the drug.
Uncertainties: A section dedicated to acknowledging what is not yet known about the drug, which might include long-term effects, interactions with other drugs, or impacts on specific populations.
Regulatory Context: Information on how the drug fits within the existing regulatory landscape, including any special designations (like orphan drug status) or comparable drugs.
Examples of Context Table Use
Here are hypothetical examples to illustrate how a Context Table might be used:
Example 1: A New Cancer Drug
- Drug Information: XYZ, a novel chemotherapy agent.
- Benefits Summary: Potential to shrink tumors more effectively than current treatments.
- Risk Summary: Side effects include nausea, fatigue, and rare but severe liver toxicity.
- Uncertainties: Long-term survival benefits unknown; effects on pediatric patients not studied.
- Regulatory Context: First in its class; fast-tracked for review due to unmet need in aggressive cancers.
Example 2: A Drug for Rare Genetic Disorder
- Drug Information: ABC, targeting a specific genetic mutation in Disorder R.
- Benefits Summary: Shown to improve quality of life in early trials.
- Risk Summary: Possible genetic side effects not fully understood; potential for allergic reactions.
- Uncertainties: Long-term efficacy and safety data is lacking; unclear if the benefits outweigh the risks.
- Regulatory Context: Orphan drug status; no existing treatments for Disorder R.
Best Practices
Conciseness: The table should be concise, ideally not exceeding one page.
Synthesis over Copy-Pasting: Rather than simply copying data, it should synthesize information to provide meaningful insights.
Clarity and Accessibility: Information should be presented clearly, avoiding overly technical language to ensure it’s accessible to all stakeholders.
In summary, the Context Table is a strategic tool in drug development, particularly at the FTiH stage, facilitating a clear understanding of the benefits, risks, and uncertainties of new drugs, thereby aiding in informed decision-making.
Key considerations of each aspect in the Context Table are as follows.
Analysis of Condition
What to Consider: Define the disease or condition, why this specific group is targeted, size, special subgroups, common additional health issues, disease progression, need for quick treatment approval, and patient perspectives.
For example: If developing a drug for asthma, consider how many people have asthma, if children are affected differently, if there are common issues like allergies, and if patients need faster relief options.
Current Treatment Options
What to Consider: List existing treatments, their market presence, effectiveness, problems with us, and upcoming competing drugs.
Example: With asthma, consider current inhalers, and their effectiveness, if people forget to use them, and if new inhalers are coming to market soon.
Potential Benefits
What to Consider: Provide evidence for why the drug could work, understand the drug’s action and body interaction, check if the drug’s action is known to help the condition, reliability of lab tests, and manufacturing concerns.
Example: Show how a new asthma drug reduces airway inflammation better than current options, backed by studies and how it works in the body.
Potential Safety Risks
What to Consider: Summarize safety concerns from early studies, identify any toxic effects, assess risks related to the drug’s action, compare safety concerns with similar drugs, and plan for managing these risks.
Example: If the asthma drug has a high dose toxicity in animals, consider what that means for human use, and compare it to other asthma treatments with known side effects.
Table 1: Benefit-Risk Analysis for an Asthma Drug
| Analysis of | Condition | Example (Asthma Drug) |
|---|---|---|
| Analysis of Condition | Target indication/population, population understanding, population size, subpopulations, co-morbidities, disease course, accelerated approval, patient-centric factors | Target: Asthma patients; Size: Millions globally; Subpopulations: Children; Co-morbidities: Allergies; Patient-centric: Need for fast-acting relief |
| Current Treatment Options | Existing treatments, market share, response rate, compliance issues, competitive landscape, success factors | Existing: Inhalers; Market share: High for current brands; Compliance issues: Forgetting doses; Upcoming competition: New inhaler technologies |
| Potential Benefits | Justification for efficacy, MOA & PKPD understanding, MOA effectiveness, preclinical model validation, manufacturing/formulation issues, clinical importance | Efficacy: Better inflammation control; MOA: Reduces airway constriction; Preclinical models: Animal studies show promise; Manufacturing: Consistent formulation |
| Potential Safety Risks | Preclinical findings, dose-limiting toxicities, on/off-target effects, MOA-related risks, competitor safety issues, safety risk management | Preclinical: High-dose toxicity in animals; MOA risks: Minimal; Competitor issues: Similar drugs have known side effects; Risk management: Monitoring plan for high doses |
Value Tree
The “value tree” method is a structured approach to drug benefit-risk assessment that helps to visualize and organize the different factors that contribute to the overall value of a drug. It is a hierarchical framework that breaks down the decision-making criteria into a tree structure, with the primary decision (e.g., the overall benefit-risk balance of a drug) at the root, and branches representing different categories of benefits and risks.
Components of a Value Tree:
- Root: The primary assessment of the overall benefit-risk balance.
- Main Branches: Major categories of benefits (e.g., efficacy, quality of life) and risks (e.g., safety, tolerability).
- Sub-branches: Specific endpoints or factors within each category (e.g., under-efficacy: reduction in disease symptoms, prevention of disease progression).
- Leaves: The measurable outcomes or metrics that provide evidence for each factor (e.g., under reduction in disease symptoms: percentage of patients with symptom improvement).
Steps in Using a Value Tree for Drug Assessment:
- Identification of Attributes: Define the key benefits and risks that are important to patients, healthcare providers, and regulatory bodies.
- Structure the Tree: Organize these attributes into a hierarchy from general to specific.
- Weighting: Assign weights to each attribute to reflect its relative importance in the overall benefit-risk assessment.
- Scoring: Score each attribute based on the drug’s performance relative to these measures.
- Aggregation: Combine the scores, taking into account the weights, to reach an overall benefit-risk balance.
Example:
Suppose a new drug, Drug A, is developed for treating a chronic condition like rheumatoid arthritis. A value tree analysis might proceed as follows:
Root: Overall benefit-risk balance of Drug A.
Main Branches: Benefits (Efficacy, Quality of Life) and Risks (Safety, Tolerability).
Sub-branches:
- Efficacy: Symptom improvement, prevention of disease progression.
- Quality of life: Pain reduction, improvement in daily functioning.
- Safety: Incidence of serious adverse events, and long-term health risks.
- Tolerability: Rate of minor side effects, patient-reported symptom distress.
Leaves:
- Symptom improvement: Percentage of patients with a 50% reduction in symptoms.
- Prevention of disease progression: Percentage of patients with no progression in joint damage over 2 years.
- Pain reduction: Average reduction in pain score on a standardized scale.
- Improvement in daily functioning: Score on a physical functioning questionnaire.
- Incidence of serious adverse events: Number of patients experiencing serious adverse events per year.
- Long-term health risks: Evidence from long-term studies or historical data.
- Rate of minor side effects: Percentage of patients experiencing side effects.
- Patient-reported symptom distress: Scores from a symptom distress scale.
Weighting and Scoring: Suppose, after consulting with stakeholders, the following weights are assigned (on a scale of 1 to 10):
- Efficacy: 8
- Quality of Life: 7
- Safety: 9
- Tolerability: 6
And the scores for Drug A might be:
- Efficacy: 7 (due to good symptom improvement but moderate prevention of disease progression)
- Quality of Life: 6 (due to good pain reduction but moderate improvement in daily functioning)
- Safety: 5 (due to a moderate incidence of serious adverse events)
- Tolerability: 7 (due to a low rate of minor side effects and low symptom distress)
Aggregation: The overall benefit-risk score for Drug A could then be calculated by multiplying each score by its weight and summing the results:
Overall Benefit-Risk Score = (Efficacy Score × Efficacy Weight) + (Quality of Life Score × Quality of Life Weight) + (Safety Score × Safety Weight) + (Tolerability Score × Tolerability Weight)
Overall Benefit-Risk Score = (7 × 8) + (6 × 7) + (5 × 9) + (7 × 6) = 56 + 42 + 45 + 42 = 185
The maximum possible score would be if the drug scored a perfect 10 in each category, which would be (10 × 8) + (10 × 7) + (10 × 9) + (10 × 6) = 80 + 70 + 90 + 60 = 300.
So, Drug A’s overall score of 185 could be compared against this maximum to determine where it stands in terms of benefit-risk balance. The decision-makers would then interpret this score in the context of available treatments, the severity of the condition, and the needs of the patient population to make an informed decision regarding the drug’s approval and use.
In practice, the process is more complex and involves a thorough analysis of clinical trial data, and post-marketing surveillance data, and may include more sophisticated multi-c. The “value tree” method is a tool used in drug benefit-risk assessment to systematically evaluate the various components of a drug’s therapeutic value. It is particularly useful in situations where complex decisions need to be made, and there is a need to balance a drug’s different positive and negative effects.
Here is a step-by-step explanation of the value tree method followed by a hypothetical example:
Steps in the Value Tree Method:
- Define the Decision Context: Identify the drug’s intended use, the patient population, and the therapeutic alternatives.
- Develop the Value Tree: Create a hierarchical structure that breaks down the decision into its core components. At the top level, differentiate between benefits and risks. Under each category, list specific sub-categories and further break them down into individual endpoints or criteria.
- Collect Data: Gather quantitative and qualitative data on each endpoint. This will typically come from clinical trials, observational studies, and other scientific research.
- Assess and Score: Evaluate each endpoint based on the collected data. Scoring can be qualitative (e.g., high, medium, low) or quantitative (e.g., using a 1-10 scale).
- Weight the Importance: Not all endpoints will be equally important. Assign weights to each based on their relative importance to patients, healthcare providers, and regulatory bodies.
- Aggregate Scores: Combine the scores from each endpoint, taking into account the assigned weights, to calculate an overall benefit-risk score.
- Interpretation: Review the aggregated score and interpret what it means for the overall value of the drug. This will inform the decision-making process for regulatory approval or clinical use.
Hypothetical Example:
Drug X is a new medication for managing type 2 diabetes. The goal is to assess its overall benefit-risk profile using the value tree method.
Value Tree Structure:
Root: Overall Benefit-Risk Assessment of Drug X
Main Branches:
- Benefits
- Efficacy
- Reduction in HbA1c levels
- Weight control
- Quality of Life
- Improvement in diabetes-related symptoms
- Patient Satisfaction
- Risks
- Safety
- Incidence of severe hypoglycemia
- Cardiovascular events
- Tolerability
- Gastrointestinal side effects
- Headaches
Data Collection:
- Efficacy: Clinical trials show an average reduction in HbA1c of 1.5% and a weight loss of 2 kg.
- Quality of Life: Patient surveys indicate moderate improvement in symptoms and high satisfaction.
- Safety: A low incidence of severe hypoglycemia but a slight increase in non-fatal cardiovascular events compared to the control group.
- Tolerability: High incidence of mild gastrointestinal side effects, low incidence of headaches.
Scoring and Weighting:
- Efficacy: HbA1c reduction (8/10), Weight control (6/10)
- Quality of Life: Symptoms (7/10), Patient satisfaction (7/10)
- Safety: Hypoglycemia (9/10), Cardiovascular events (5/10)
- Tolerability: Gastrointestinal (4/10), Headaches (8/10)
Weights reflect the relative importance of each endpoint, determined by discussions with stakeholders.
For this example, reducing HbA1c and avoiding severe hypoglycemia may be considered the most critical, so they are given higher weights.
Aggregation:
To calculate the overall benefit-risk score, each endpoint’s score is multiplied by its weight. For simplicity, assume each main category has an equal weight:
Total Possible Score
(Efficacy Score×Efficacy Weight)+(Quality of Life Score×Quality of Life Weight) (Safety Score×Safety Weight)+(Tolerability Score×Tolerability Weight)
This aggregated score is then compared to a predefined threshold or the scores of existing therapies to decide the drug’s value in the treatment of type 2 diabetes.
Interpretation:
If the overall benefit-risk score is high, it suggests that the benefits of Drug X outweigh its risks, potentially justifying its approval and use in the patient population. If the score is low, it may indicate that the risks are too significant relative to the benefits, necessitating further investigation or comparison with alternative therapies.
The value tree method is not without its limitations. It requires subjective judgment in the assignment of weights and interpretation of scores, and it may not capture all the nuances of individual patient preferences. Nevertheless, it provides a structured framework to guide the decision-making process in drug benefit-risk assessment.
Table 2: Benefit-Risk Assessment Components for an Asthma Drug
| Component | Description | Example |
|---|---|---|
| Context Table | A tool for a concise overview of evidence and uncertainties at the FTiH milestone | Analysis of Condition: Asthma in adults Current Treatment Options: Existing bronchodilators Potential Benefits: Improved lung function Potential Safety Risks: Mild throat irritation |
| Analysis of Condition | Understanding the target indication/population, its size, subpopulations, and key co-morbidities. | Target: Adult asthma patients Subpopulation: Patients with chronic bronchitis |
| Current Treatment Options | Assessing existing treatments, their market share, and clinical effectiveness | Existing bronchodilators with 60% market share Known compliance issues with current inhalers |
| Potential Benefits | Justifying the efficacy of the new treatment based on evidence, MOA, and clinical importance. | Improved lung function measured by FEV1 increase Anticipated reduction in asthma attacks |
| Potential Safety Risks | Summarizing preclinical findings, dose-limiting toxicities, and potential safety risks. | Mild throat irritation in 10% of trial participants No significant dose-limiting toxicities |
| Component | Description | Examples |
|---|---|---|
| Value Tree | A visual representation of the most impactful attributes of the product’s benefit-risk balance. | KCBs: Improved lung function, reduced asthma attacks KSRs: Throat irritation, rare allergic reactions |
| Avoiding Overlap in KCBs | Ensuring that clinical efficacy measures are distinct and not redundant. | Focus on the most significant endpoint: Reduction in asthma attacks, rather than multiple similar endpoints |
| Avoiding Overlap in KSRs | Ensuring that safety risks are distinct and not overlapping, to avoid double-counting. | Separate categorization of tolerability issues and serious adverse events (SAEs) to avoid redundancy |
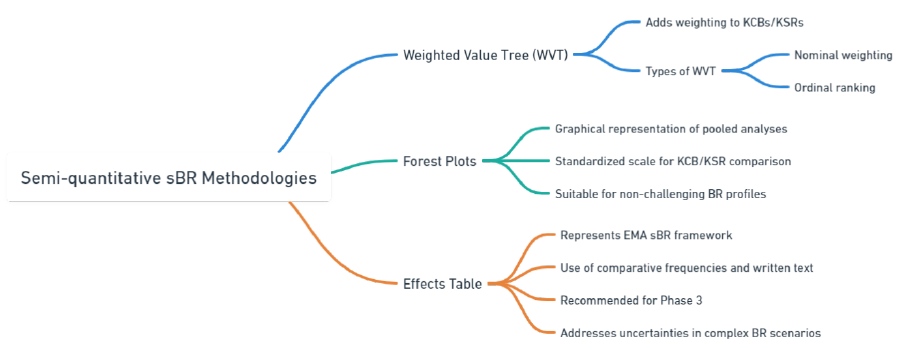
Semi-quantitative sBR methodologies
Semi-quantitative sBR methodologies aim to present the benefit-risk assessment in a concise manner using either basic statistical analyses or ordinal ranking of the Key Clinical Benefits (KCBs) and Key Safety Risks (KSRs).
Weighted Value Tree (WVT)
The Weighted Value Tree (WVT) method is a structured, quantitative approach used in various fields, including drug safety assessment, to facilitate decision-making by breaking down complex decisions into simpler, more manageable parts. This method allows stakeholders to evaluate the benefits and risks of drugs by assigning weights to different criteria based on their relative importance, and then scoring each criterion to reflect the magnitude of its positive or negative impact. Here’s how the WVT method can be applied in drug safety, along with a simplified example.
Benefits of the Weighted Value Tree Method for Drug Safety
- Structured Decision-Making: WVT provides a systematic framework for assessing the multifaceted aspects of drug safety and efficacy, helping to ensure that all relevant factors are considered.
- Transparency: By breaking down the decision process into clearly defined steps and criteria, WVT enhances the transparency of the decision-making process.
- Stakeholder Engagement: It allows for the involvement of multiple stakeholders in the weighting and scoring process, ensuring that diverse perspectives are considered.
- Quantitative Analysis: WVT quantifies benefits and risks, facilitating a more objective comparison between different drugs or treatment options.
- Flexibility: The method can be adapted to different contexts and types of decisions, and it can accommodate changes in criteria or weights as new information becomes available.
Solved Example
Imagine a pharmaceutical company evaluating the safety of a new drug intended for treating a chronic condition. The decision criteria might include Efficacy, Side Effects, Long-Term Safety, and Drug Interactions. Each criterion is assigned a weight based on its importance to the overall safety profile of the drug.
Step 1: Define Criteria and Weights
- Efficacy (40%)
- Side Effects (30%)
- Long-Term Safety (20%)
- Drug Interactions (10%)
Step 2: Score Each Criterion
For simplicity, let’s use a scoring system from 1 (poor) to 5 (excellent).
- Efficacy: The drug shows a high level of effectiveness in clinical trials (Score: 5).
- Side Effects: Mild to moderate side effects were reported (Score: 3).
- Long-Term Safety: Limited data available, but no major concerns identified (Score: 4).
- Drug Interactions: Known interactions with a few common medications (Score: 2).
Step 3: Calculate Weighted Scores
Multiply each criterion’s score by its weight to get the weighted scores.
- Efficacy: 5 (Score) * 0.40 (Weight) = 2.0
- Side Effects: 3 * 0.30 = 0.9
- Long-Term Safety: 4 * 0.20 = 0.8
- Drug Interactions: 2 * 0.10 = 0.2
Step 4: Sum Weighted Scores
Sum the weighted scores to get an overall safety and efficacy score for the drug.
- Overall Score: 2.0 + 0.9 + 0.8 + 0.2 = 3.9 out of 5
Step 5: Interpretation
Based on the overall score, stakeholders can conclude that the drug presents a favorable safety and efficacy profile, albeit with some concerns regarding drug interactions and side effects. This quantitative score, combined with qualitative assessments, can inform regulatory submissions, prescribing information, and marketing strategies.
Conclusion
The Weighted Value Tree method offers a systematic, transparent, and flexible approach to drug safety assessment, enabling stakeholders to make informed decisions by quantitatively evaluating the benefits and risks of drugs. It’s important to note that while WVT can significantly aid in decision-making, it should be used alongside other assessment tools and in the context of comprehensive drug safety evaluations.
Forest Plots
The Forest Plot is a graphical representation widely used in meta-analyses and systematic reviews to show the strength of the evidence across multiple studies or comparisons. It’s particularly useful in drug safety and efficacy assessments because it visually aggregates results from various studies, allowing for a quick comparison of the effects of a drug versus a control or another drug across different outcomes. In the context of benefit-risk assessment for drug safety, Forest Plots can illustrate the relative risks, odds ratios, or hazard ratios of adverse events associated with a drug, alongside confidence intervals to indicate the precision of these estimates.
Benefits of the Forest Plot Method for Drug Safety
- Comparative Analysis: Forest Plots provide a clear visual comparison of drug safety across multiple studies, highlighting variations and consistencies in outcomes
- Evidence Summary: They succinctly summarize a large volume of data, making it easier to digest complex information and discern patterns or anomalies in drug safety profiles.
- Confidence Interval Visualization: By displaying confidence intervals, Forest Plots help assess the reliability and precision of the observed effects, indicating whether differences are statistically significant.
- Facilitates Decision Making: This method supports evidence-based decision-making by providing a visual overview of the balance between benefits and risks, helping stakeholders to weigh these factors more effectively.
Solved Example
Let’s consider a simplified example where a pharmaceutical company is evaluating the safety of a new cardiovascular drug. The primary safety concerns are the risks of developing major cardiovascular events (MCEs) such as myocardial infarction, stroke, and cardiovascular death.
Step 1: Gather Data from Multiple Studies
Assume we have data from three different studies comparing the new drug to a placebo. The outcome of interest is the occurrence of MCEs.
- Study 1: Odds Ratio (OR) = 0.8, 95% Confidence Interval (CI) = [0.65, 0.98]
- Study 2: OR = 0.9, 95% CI = [0.75, 1.07]
- Study 3: OR = 0.85, 95% CI = [0.72, 1.00]
Step 2: Create the Forest Plot
A Forest Plot would display each study on a separate line, with a point estimate of the OR and a horizontal line representing the 95% CI. A vertical line (often called the line of no effect) represents an OR of 1, where values to the left indicate a risk reduction (favoring the new drug), and values to the right indicate an increased risk.
Step 3: Interpretation
- Study 1 shows a statistically significant reduction in the risk of MCEs when using the new drug (as the CI does not cross the line of no effect).
- Study 2 suggests a non-significant trend toward risk reduction (the CI crosses the line of no effect).
- Study 3 shows a borderline significant reduction in risk (the CI just touches the line of no effect).
Overall, the Forest Plot suggests that the new drug may reduce the risk of major cardiovascular events, with Study 1 providing the strongest evidence. However, the variability in the confidence intervals across studies highlights the need for cautious interpretation and potentially further investigation.
Conclusion
Forest Plots are a powerful tool for visualizing and comparing the results of multiple studies in drug safety assessments. They help identify trends, assess the consistency of evidence, and make informed decisions regarding the benefit-risk profile of drugs. While beneficial, it’s crucial to consider the quality and heterogeneity of the included studies and to use Forest Plots in conjunction with other analytical methods for a comprehensive drug safety evaluation.
Effects Table
The Effects Table, also known as a Benefit-Risk Table or Summary of Product Characteristics (SmPC) a table is a tool used in the assessment of drug safety and efficacy that organizes and presents important data about the benefits and risks associated with a drug clearly and concisely. This method facilitates a straightforward comparison of the positive and negative effects of a drug, making it easier for healthcare professionals, regulators, and patients to make informed decisions.
Benefits of the Effects Table Method for Drug Safety
- Comprehensive Overview: It provides a comprehensive summary of the drug’s safety and efficacy profile, including both beneficial outcomes and potential adverse effects.
- Clear Comparison: The table format allows for a direct comparison of different aspects of the drug performance, such as efficacy rates, incidence of side effects, and serious adverse events.
- Quantitative and Qualitative Data: The Effects Table can include both quantitative data (e.g., percentages, rates) and qualitative insights (e.g., severity of side effects), offering a multifaceted view of the drug’s impact.
- Stakeholder Communication: It serves as an effective communication tool among different stakeholders, including regulatory agencies, healthcare professionals, and patients, by presenting data in an accessible format.
- Decision Support: By clearly laying out the benefits and risks, the Effects Table aids in the decision-making process, supporting a balanced evaluation of a drug’s overall value.
Solved Example
Consider a pharmaceutical company that has developed a new medication, Drug X, for the treatment of hypertension. The company wants to assess the drug’s benefit risk profile using an Effects Table.
Step 1: Identify Key Benefits and Risks
Benefits:
- Reduction in systolic blood pressure (SBP)
- Reduction in diastolic blood pressure (DBP)
- Improvement in patient-reported quality of life
Risks:
- Incidence of dizziness
- Incidence of gastrointestinal issues (e.g., nausea, vomiting)
- Risk of developing a rash
Step 2: Collect Data
Data is gathered from clinical trials to fill in the Effects Table.
Step 3: Create the Effects Table
| Effect Category | Drug X | Placebo | Comment |
|---|---|---|---|
| Benefits | |||
| Reduction in SBP | 15 mmHg | 5 mmHg | Mean reduction from baseline |
| Reduction in DBP | 10 mmHg | 3 mmHg | Mean reduction from baseline |
| Quality of Life Improved | Slightly improved | Based on the patient survey | |
| Risks | |||
| Incidence of Dizziness | 10% | 2% | Percentage of patients experiencing symptoms |
| Gastrointestinal Issues | 5% | 1% | Percentage of patients experiencing symptoms |
| Risk of Rash | 3% | <1% | Percentage of patients developing a rash |
Step 4: Interpretation
The Effects Table shows that Drug X is effective in reducing both systolic and diastolic blood pressure significantly more than the placebo. It also improves the quality of life for patients with hypertension. However, there is a higher incidence of dizziness, gastrointestinal issues, and rash compared to the placebo group. These findings will help healthcare professionals and patients weigh the benefits of blood pressure reduction and quality of life improvement against the potential side effects.
Conclusion
The Effects Table is a valuable tool in the benefit-risk assessment of drugs, offering a clear and organized presentation of critical data. By providing a side-by-side comparison of benefits and risks, it supports informed decision-making in drug development, regulatory approval, and clinical use. While effective, the interpretation of an Effects Table should always consider the broader context of patient needs, clinical guidelines, and the therapeutic landscape.
Table 3: Benefit-Risk Assessment Components for Evaluation
| Component | Description | Examples |
|---|---|---|
| Tree (WVT) | Adds weighting to KCBs/KSRs to rank their importance. | Weighted Value: Nominal Weighting: – KCB: Efficacy (weight 70%) – KSR: Mild side effects (weight 30%) Ordinal Ranking: – 1st KCB: Improved survival rates – 2nd KCB: Reduced symptom severity |
| Forest Plots | Provides a graphical representation of pooled analyses with standardized scales for comparison. | Graph showing efficacy of a new drug compared to standard treatment, with confidence intervals for each KCB/KSR. |
| Effects Table | Uses comparative frequencies and written text to address uncertainties in complex BR scenarios. | Comparative Frequencies: – Observed efficacy rate in trial group vs control group Written Text: – Discussion on the clinical relevance of observed differences in side effect profiles |
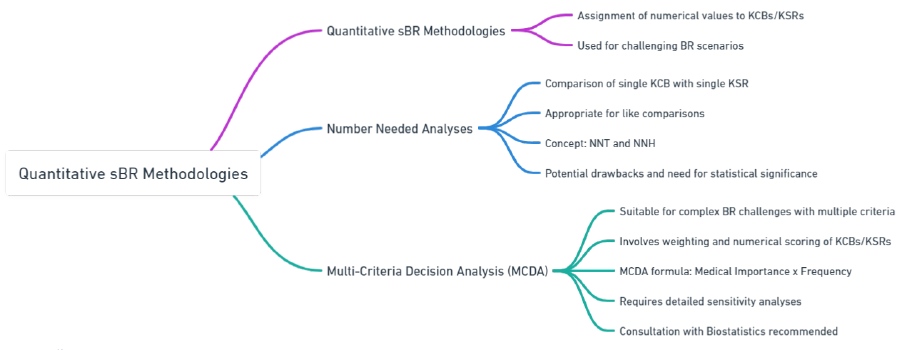
Quantitative methodologies
Fully quantitative sBR assessments are typically used for challenging benefit-risk scenarios. They involve assigning a numerical value to each Key Clinical Benefit (KCB) and Key Safety Risk (KSR) and comparing these values to determine the overall benefit-risk profile. For example, if the numerical value for KCBs is higher than that for KSRs, the benefit-risk profile is considered favorable.
When using a quantitative methodology, several considerations are important. Weighting exercises are necessary to assign numerical values to KCBs and KSRs. It is crucial to avoid duplication or double-counting when selecting these factors. Additionally, certain endpoints may not be independent, and the concept of “preferential independence” should be acknowledged.
This section focuses on two commonly employed quantitative sBR methodologies with regulatory precedent: Numbers Needed Analyses and Multi-Criteria Decision Analysis. However, it is worth noting that a wide range of quantitative methods for sBR exist in the medical scientific literature, and project teams can explore these methods on a case-by-case basis in consultation with the Benefit-Risk Assessment Committee if needed.
Number Needed Analyses
Number Needed analyses are useful when comparing a single Key Clinical Benefit (KCB) with a single Key Safety Risk (KSR) for a specific product. They can also be applied when comparing between multiple products (e.g., NNT for Drug A vs NNT for Drug B).
When conducting a Number Needed analysis, it is important to compare similar events. For instance, it is appropriate to compare the clinical benefit of preventing myocardial infarction with the safety risk of increased stroke since both are types of major adverse cardiovascular events (MACE) and can be reasonably compared in terms of severity and medical importance.
However, it would not be appropriate to compare the clinical benefit of headache reduction with a risk of cerebrovascular accident (CVA) because these events are different and significantly differ in severity and medical importance. This comparison of like with like implicitly involves a weighting exercise.
The Number Needed to Treat (NNT) and Number Needed to Harm (NNH) are important metrics in the assessment of drug safety and efficacy. These measures are part of the “number needed analyses” which provide a straightforward way to quantify how many patients need to be treated with a particular drug to achieve one additional beneficial outcome (NNT) or to cause one additional adverse effect (NNH) compared to a control treatment. This approach helps in understanding the practical significance of a drug’s effects, balancing the benefits against the risks in a way that is both intuitive and evidence-based.
Benefits of Number Needed Analyses for Drug Safety
- Intuitive Interpretation: NNT and NNH offer a clear and easily understandable measure of a drug’s impact, making complex trial data more accessible to clinicians and patients.
- Direct Comparison: They allow for direct comparison between different drugs or treatments, facilitating decision-making by highlighting the efficiency and safety profiles.
- Evidence-Based Decision Making: These metrics help in making informed decisions based on quantifiable evidence of how many patients are likely to benefit or be harmed.
- Risk-Benefit Balance: By comparing NNT and NNH, healthcare providers can better assess the overall benefit-risk balance of a drug, guiding more personalized treatment choices.
Solved Example
Imagine a new drug, Drug Y, intended for the treatment of a chronic disease. Clinical trials have shown the following:
- Drug Y reduces the risk of a major disease-related event by 5% compared to placebo over 5 years. The incidence of this event in the placebo group is 20%.
- The main serious side effect of Drug Y, compared to placebo, increases by 2%. The incidence of this side effect in the placebo group is 3%.
Step 1: Calculate NNT
The NNT is calculated based on the absolute risk reduction (ARR), which is the difference in event rates between the treatment and control groups.
ARR (for benefit)=Incidence in the control group−Incidence in the treatment group
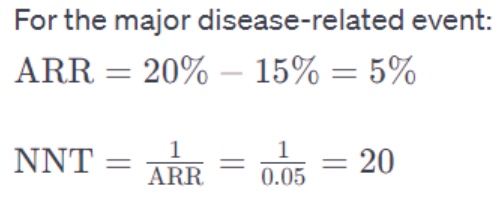
This means 20 patients need to be treated with Drug Y for 5 years to prevent one major disease-related event compared to a placebo.
Step 2: Calculate NNH
The NNH is similarly calculated based on the additional risk introduced by the drug.
Additional Risk (for harm)=Incidence in treatment group−Incidence in the control group
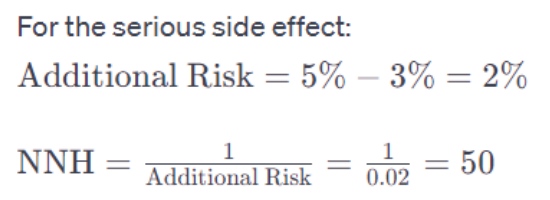
This means that one additional patient out of 50 treated will experience serious side effects due to Drug Y compared to the placebo.
Interpretation
- NNT (20): This value indicates a relatively efficient intervention for preventing the major disease-related event, as treating 20 patients to benefit one is considered a favorable outcome in many cases.
- NNH (50): This suggests that the risk of serious side effects is relatively low, as 50 patients need to be treated for one additional adverse event to occur.
Conclusion
Number needed analyses, including NNT and NNH, provide valuable insights into the benefit-risk profile of drugs. In the case of Drug Y, the comparison of NNT and NNH suggests that the benefits of reducing disease-related events potentially outweigh the risks of serious side effects for many patients. However, these decisions must always consider individual patient factors, preferences, and the clinical context. This method emphasizes the importance of quantitative measures in guiding clinical decision-making and promoting patient-centered care.
Multi-Criteria Decision Analysis (MCDA)
Multi-Criteria Decision Analysis (MCDA) is a powerful tool for complex benefit-risk challenges, especially when there are multiple Key Clinical Benefits (KCBs) and Key Safety Risks (KSRs) of varying importance. It is most useful in situations where preferences play a significant role. However, due to the commitment and resources required, its use should be carefully considered.
MCDA aims to account for trade-offs between multiple criteria or endpoints. It involves identifying relevant endpoints, assigning weights (relative importance) to each, and summarizing them with numerical scores. By adding up the scores, the overall balance between benefits and risks can be assessed.
To calculate the discrete numerical values in MCDA, the weighting (importance) of each criterion is multiplied by its frequency (observed or estimated). Weighting is a crucial part of MCDA, and input from external experts or patient advocacy groups may be advisable in certain cases to ensure objectivity.
Once the numerical values are obtained, they can be graphically presented to visualize the net clinical benefit. In a favorable benefit-risk profile, the sum of numerical values for KCBs should exceed that for KSRs. It is important to have independent endpoints and avoid duplication between KCBs and KSRs, similar to other methodologies like the Value Tree.
It is worth noting that the final derivation of MCDA analyses is more complex than described here, including detailed sensitivity analyses. Therefore, consultation with Biostatistics is necessary to ensure accuracy and reliability.
Let’s consider an example to illustrate the application of Multi-Criteria Decision Analysis (MCDA) in a benefit-risk assessment.
Suppose we have two different drugs, Drug A and Drug B, being evaluated for the treatment of a specific medical condition. We have identified three Key Clinical Benefits (KCBs) and two Key Safety Risks (KSRs) as relevant criteria for the assessment:
Key Clinical Benefits (KCBs):
- Reduction in symptom severity
- Improvement in quality of life
- Decreased risk of hospitalization
Key Safety Risks (KSRs):
- Risk of gastrointestinal side effects
- Risk of cardiovascular adverse events
To conduct an MCDA, we assign relative weights to each criterion based on their perceived importance. Let’s say we assign the following weights:
KCBs:
- Reduction in symptom severity – Weight: 0.4
- Improvement in quality of life – Weight: 0.3
- Decreased risk of hospitalization – Weight: 0.3
KSRs:
- Risk of gastrointestinal side effects – Weight: 0.6
- Risk of cardiovascular adverse events – Weight: 0.4
Next, we assess each drug’s performance on these criteria and assign numerical scores based on observed or estimated frequencies. Let’s assume the following scores on a scale of 1 to 10 (higher scores indicating better performance):
Drug A:
- Reduction in symptom severity: Score: 8
- Improvement in quality of life: Score: 7
- Decreased risk of hospitalization: Score: 6
- Risk of gastrointestinal side effects: Score: 3
- Risk of cardiovascular adverse events: Score: 4
Drug B:
- Reduction in symptom severity: Score: 9
- Improvement in quality of life: Score: 6
- Decreased risk of hospitalization: Score: 5
- Risk of gastrointestinal side effects: Score: 6
- Risk of cardiovascular adverse events: Score: 7
Now, we calculate the weighted scores for each drug by multiplying the weights with the respective scores. For example:
Drug A weighted scores:
- Reduction in symptom severity: 0.4 * 8 = 3.2
- Improvement in quality of life: 0.3 * 7 = 2.1
- Decreased risk of hospitalization: 0.3 * 6 = 1.8
- Risk of gastrointestinal side effects: 0.6 * 3 = 1.8
- Risk of cardiovascular adverse events: 0.4 * 4 = 1.6
Drug B weighted scores:
- Reduction in symptom severity: 0.4 * 9 = 3.6
- Improvement in quality of life: 0.3 * 6 = 1.8
- Decreased risk of hospitalization: 0.3 * 5 = 1.5
- Risk of gastrointestinal side effects: 0.6 * 6 = 3.6
- Risk of cardiovascular adverse events: 0.4 * 7 = 2.8
Finally, we compare the overall benefit-risk profiles of Drug A and Drug B by adding up the weighted scores for each drug. In this example, Drug B has a higher total weighted score, indicating a more favorable benefit-risk profile compared to Drug A.
The MCDA approach enables a comprehensive assessment that accounts for multiple criteria and their relative importance, providing a quantitative measure of the benefit-risk balance for each drug.
Table 4: Quantifying Effectiveness and Making Informed Choices: Number Needed Analyses and Multi-Criteria Decision Analysis in Focus
| Component | Description | Examples |
|---|---|---|
| Number Needed Analyses | Compares a single KCB with a single KSR, focusing on like comparisons. | NNT (Number Needed to Treat): 50 patients need to be treated for one to benefit from reduced blood pressure. NNH (Number Needed to Harm): 200 patients need to be treated for one to experience a significant side effect. |
| Considerations for Number Needed Analyses | Important to compare similar types of events in terms of severity and medical importance. | Comparing reduction in heart attack risk (KCB) with increased risk of stroke (KSR) due to similar severity. |
| Multi-Criteria Decision Analysis (MCDA) | Involves weighting and numerical scoring of multiple KCBs/KSRs, suitable for complex BR challenges. | Weighting Example: Efficacy in reducing symptoms (weight 60%), Risk of mild side effects (weight 40%). Scoring Example: Efficacy score: 80, Side effect score: 30. |
| MCDA Formula | Combines medical importance and frequency to derive a numerical value for each KCB/KSR. | MCDA Value = Medical Importance (e.g., 60% for efficacy) x Frequency (e.g., observed in 80% of patients). |
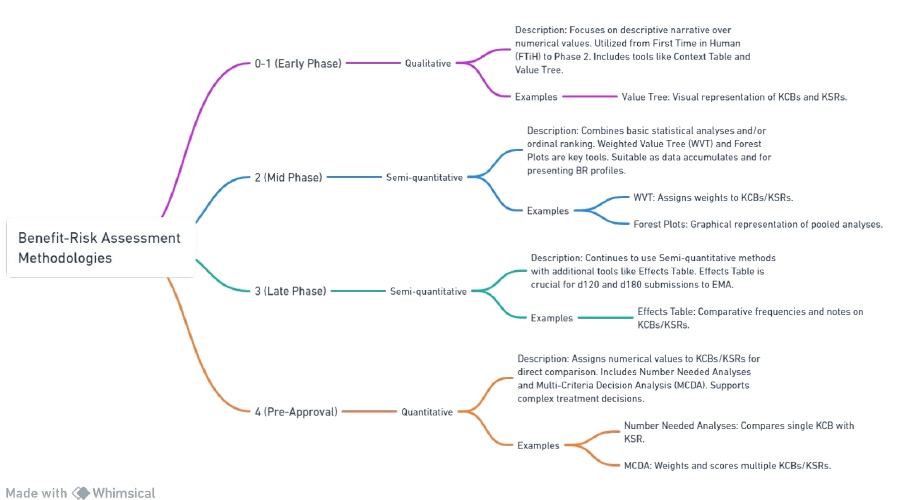
| Phase | Methodology | Description | Examples |
|---|---|---|---|
| 0-1 (Early Phase) | Qualitative |
|
Context Table: Overview of evidence and uncertainties at FTiH. Value Tree: Visual representation of KCBs and KSRs. |
| Mid Phase |
|
WVT: Assigns weights to KCBs/KSRs. Forest Plots: Graphical representation of pooled analyses. |
|
| 3 (Late Phase) | Semi-quantitative |
|
Effects Table: Comparative frequencies and notes on KCBs/KSRs. |
| 4 (Pre-Approval) | Quantitative |
|
Number Needed Analyses: Compares single KCB with KSR. MCDA: Weights and scores multiple KCBs/KSRs. |