
Interactive Games – Survival Analysis & Decision Making
Interactive Games – Survival Analysis & Decision Making
Click into each game, make your decision, then reveal the suggested answer and teaching points. Learners can type their reasoning before seeing feedback.
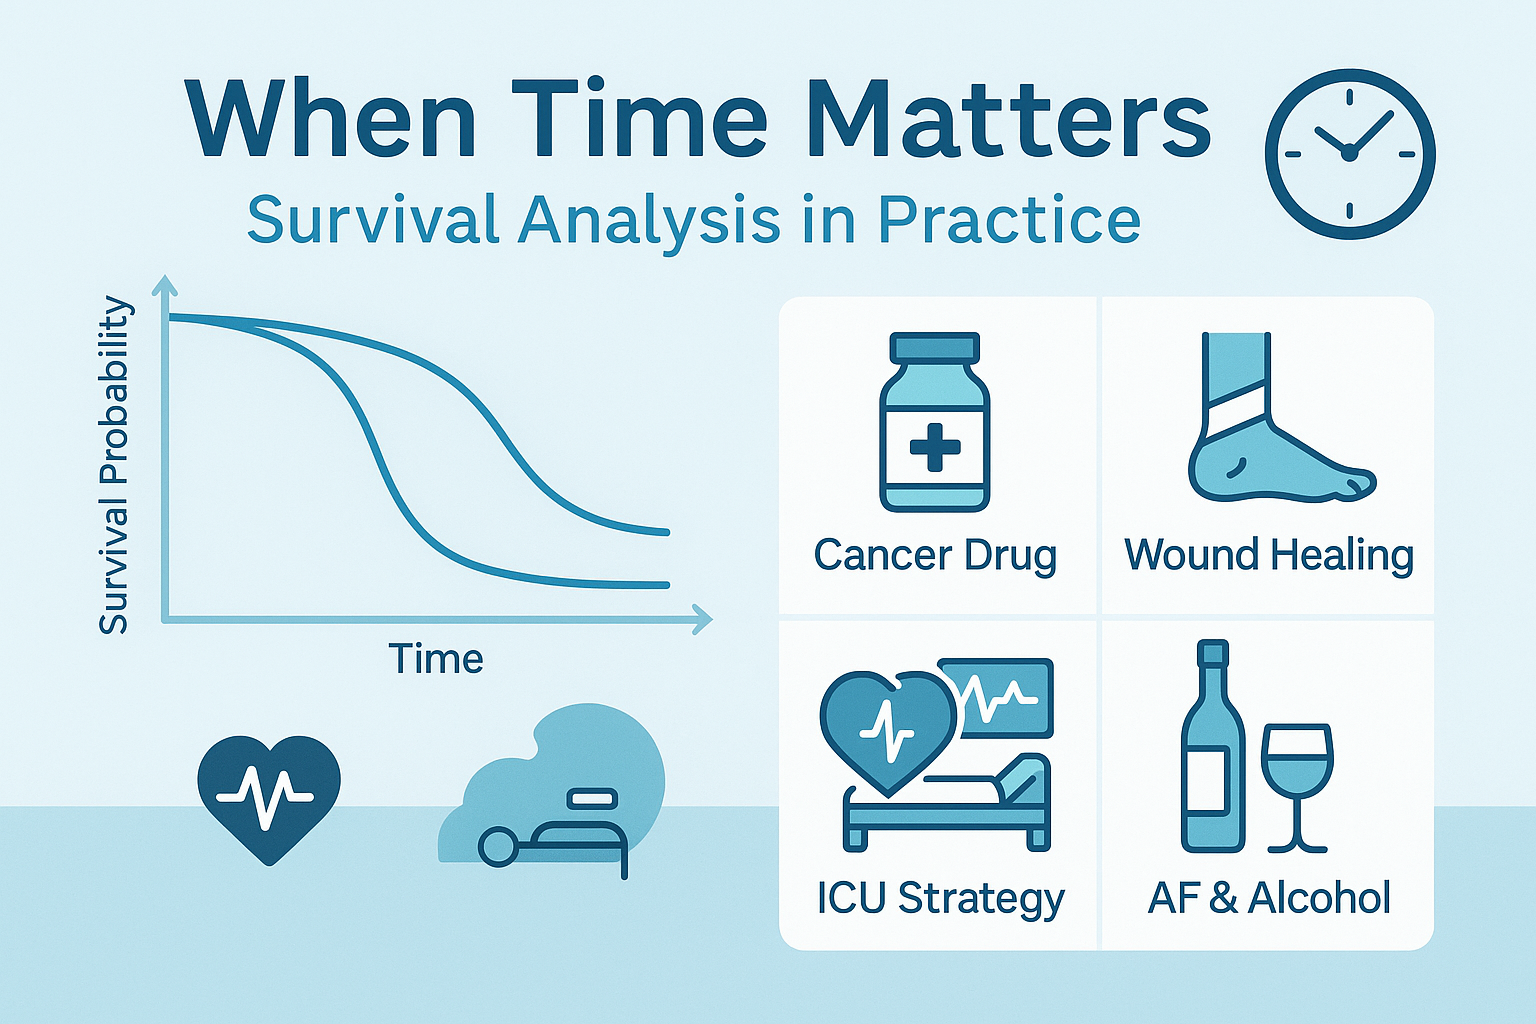
Which Treatment Fits Which Patient?
Learners choose a treatment based on survival patterns and toxicity, then compare with the suggested choice.
- Read the mini “trial result” and patient story.
- Type your decision and why.
- Click “Show model answer” to compare.
Metastatic colorectal cancer, age 52, otherwise healthy and motivated to trade toxicity for longer life.
The trial shows:
• Drug A: Median OS 30 vs 20 months, HR 0.65, but high neuropathy and fatigue.
• Drug B: Median OS 24 vs 20 months, HR 0.80, milder toxicity.
Your decision (A or B, and why?):
Same data, but the patient is 81 with moderate frailty and values staying comfortable and independent.
Your decision (A or B, and why?):
Clinically Meaningful or Mostly Hype?
Learners classify trial results as clearly meaningful, probably meaningful, or mostly statistical noise.
Choose an option, then press “Check”. A short explanation appears below.
Card 1 – Heart Failure Drug
HR 0.88 (95% CI 0.80–0.96, P=0.004) for HF hospitalization. Baseline risk 40%. Drug costs $600/month,
side-effects mild.
Card 2 – Oncology Maintenance Therapy
HR 0.95 (95% CI 0.90–1.02, P=0.15) for overall survival. Baseline 3-year mortality 30%.
High cost and significant fatigue.
When to Step Up Wound Care
Learners decide if they should move early to an advanced dressing, based on time-to-healing information.
Grade 1 diabetic foot ulcer, painful and present for 4 weeks on basic gauze.
Trial data:
• Standard care: median healing 10 weeks, 60% healed by week 12.
• Advanced hydrogel: median healing 6 weeks, 65% healed by week 12.
Would you step up now or wait? Why?
Same trial, but your clinic has very restricted funds and the ulcer is small, non-infected, and minimally symptomatic.
Would you still step up immediately? Why or why not?
Which Curve Tells This Story?
Learners match descriptive stories to types of survival curve patterns.
Use the dropdown to choose the curve pattern you think best fits each story, then check.
Story A: Drug X quickly reduces early peri-procedural deaths, but after 2 years toxicity accumulates and curves move closer together.
Story B: Immunotherapy with little effect in the first 6 months, then a growing survival advantage for long-term responders.
Event vs Censoring Lab
Learners classify each timeline as an event or censored case and state what the event is.
Timeline 1: Patient enters HF trial on Day 0. At 10 months, trial ends; patient is alive and not hospitalized.
Timeline 2: Patient with DFU starts advanced dressing at Week 0. At Week 8, complete healing is documented. Follow-up stops.
Define the event clearly before deciding: here, the event is “complete healing”.
Pick the Right Time-to-Event Endpoint
Learners choose suitable primary endpoints for different trials and justify them.
You design a trial for a new oral anticoagulant in atrial fibrillation. Candidate primary endpoints: (A) All-cause mortality, (B) Stroke-free survival, (C) Time to first major bleed.
Which primary endpoint would you pick and why?
You are testing an alcohol-reduction program in patients with paroxysmal AF.
Propose a primary time-to-event endpoint and justify it.
Turn Hazard Ratios into Plain Numbers
Learners convert hazard ratios into simple “out of 100 people” explanations for patients.
Baseline: 40 of 100 HF patients have “death or hospitalization” over 3 years. New drug HR 0.75 for that composite outcome.
Write a patient-friendly explanation using “out of 100 people”.
Baseline: 20 of 100 patients relapse within 2 years. New adjuvant therapy HR 0.60 for relapse.
Translate this into an absolute statement for patients.
Spot the Better Survival Analysis
Learners compare two study summaries and choose which is more reliable for guiding practice.
Study A: 300 patients, reports “average time in ICU before death”
(15 vs 10 days) and claims Strategy A improves survival. Patients discharged alive are
not included in the analysis.
Study B: 320 patients, reports Kaplan–Meier curves for time to death,
includes all patients (alive, dead, discharged), uses Cox models adjusting for key
covariates.
Which study would you trust more, and why?
Use Survival Data in a Conversation
One learner plays clinician, one plays patient. Use the data to explain options in plain language.
Trial: patients with paroxysmal AF who stopped alcohol had HR 0.55 for AF recurrence vs those who continued usual drinking. Kaplan–Meier curves separate clearly over 6 months.
As the clinician, write what you would say to the patient.
Maintenance therapy offers HR 0.80 for progression-free survival but only a 2-month gain in median PFS, with significant fatigue.
Draft a balanced explanation for a patient deciding whether to start it.
Decide with Emerging Survival Data
Learners see early and later snapshots of survival data and decide when they would change practice.
New HF drug vs standard care, 6-month interim analysis:
• Slight separation of KM curves, HR 0.85 (95% CI 0.70–1.04), P=0.10.
• No new safety signals.
Would you change practice now or wait? Why?
Final analysis:
• Clear curve separation, HR 0.78 (95% CI 0.68–0.89), P<0.001.
• 2-year event rate 40% → 32%.
• Safety acceptable, cost moderate.
Would you now change practice? How would you explain the benefit?